Quantified Self Project: My YouTube Habits
For this project, I wanted to know what patterns show up in my YouTube viewing between 2022 and 2025, and how do they connect to what was happening in my life during those years?
I originally thought I’d look at my full watch history since 2014, but Google Takeout only lets me export up to 2022. That turned out to be fine, because 2022–2025 covers a really interesting stretch of my life, graduating from college, working, being unemployed, going back to work, and now returning to school.
Google Takeout gave me my watch history as an HTML file. Each entry had the video title, the channel name, and the timestamp of when I watched it. To make it usable in Tableau, I wrote a JavaScript script to convert the HTML into a CSV. I also added two extra columns: one for the day of the week and one for the hour of the day. That gave me enough structure to explore when and what I was watching.
The first bar chart shows my most-watched channels with at least 100 views. Two of my top three are ASMR channels, which makes sense since I’ve used ASMR to fall asleep since 2020. The other is a news channel I’ve followed since 2014–2015, though I thought it would rank higher. A lot of my top ten are Twitch streamers posting highlights, which tracks with me starting to watch Twitch around 2021–2022.
Breaking things out by year shows Twitch content rising fast. In 2023, Twitch barely shows up. By 2025, it dominates. My music watching also shifted—2023 was mostly one channel, but by 2025 I spread across several.
The heatmap shows which days I watched most, split by year. 2023 was the peak—graduated, more free time, lots of YouTube. In 2024, views dropped as I worked more, with spikes on Sundays and Wednesdays, my days off. The pattern continues in 2025, though less strongly, probably because my job schedule changed.
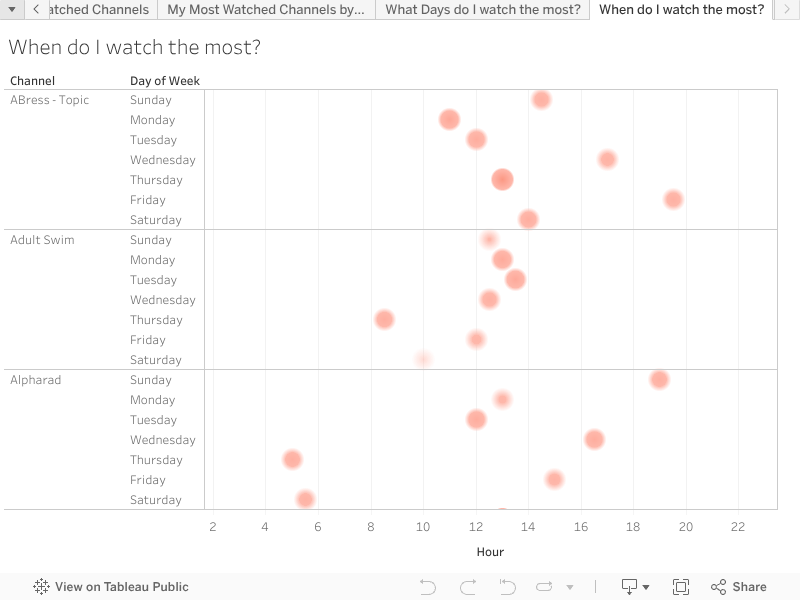
The bubble chart digs deeper: day of week plus hour. ASMR clusters late at night and early morning, which makes sense for sleep. News channels show dense bubbles on the days they post, reflecting their publishing schedule.
Looking at my YouTube history from 2022–2025, I can see habits shift alongside my life. ASMR dominates late nights, Twitch takes over in 2025, and my music taste diversifies. My overall viewing frequency mirrors my free time—more in 2023, less in 2024, when I was working more.
There are limitations. Google Takeout only gave me the video title, channel, and timestamp. No categories or video length. I couldn’t get data before 2022, so I missed the full decade I wanted. Adding day of week and hour myself means small errors are possible.
There are also biases. The dataset only reflects what Google recorded. Offline viewing or other platforms aren’t included. Heavy ASMR use skews the data toward certain channels and times.
If I did this again, I’d want to combine YouTube data with Twitch or Spotify exports to compare across platforms. I’d add video categories like news, entertainment, or music for richer analysis. And if Google ever allows longer exports, I’d expand the timeline to see how habits evolve over a decade.

This entry is licensed under a Creative Commons Attribution-NonCommercial-ShareAlike 4.0 International license.